Machine Learning Supermarket Simulator
Translate your in-store traffic patterns into actionable revenue metrics.
Store layout and product placement affect customer traffic patterns, and customer traffic patterns affect product sales.
$Sales = #Visitors x %Conversion x $AVG purchase x %Retention
For supermarkets, sales are mainly determined by the four variables above. Delving into each of these can provide us with more focus. To some degree, #Visitors is mainly decided by the location and size of the supermarket, so controlling this variable can be hard. %Retention is mainly decided by customer loyalty. This is another variable that is difficult to change quickly because it is determined by slow moving things such as brand image. So, when looking for ways to increase sales, our focus is on %Conversion and $AVG.
Traffic patterns confirm that customers do not browse an entire store but tend to favour certain areas. Obviously, if a product is not seen by its target customer it is impossible for a sale to occur.
We increase visibility of a product to a target customer to increase %Conversion and $AVG.

No data to support quantity assessment. If you can’t measure it, you can’t improve it.

No knowledge to translate in-store customer traffic patterns into actionable revenue metrics.
In the world of E-commerce we know how customers interact with a website. We know where they click, how they navigate, and how long they stay. Conversion rate optimisation is a huge thing in the E-commerce world, and analysing website traffic can literally be a full time job (a CRO Specialist).
In contrast, in the physical world of a supermarket, there is no data to tell you how your customers browse, and no knowledge about how to gain insights from the data.
A/B tests can't be conducted at the same time.

There are too many store layout and product placement combinations to be tested in the real world.

Every change has a ripple effect.
Pilot stores aren't useful for testing because every location and store layout is unique.
Again, we can make a comparison to E-commerce. Different versions of a website layout and product display can be controlled and delivered to different customers at the same time. Unfortunately this kind of A/B testing is impossible with physical stores.
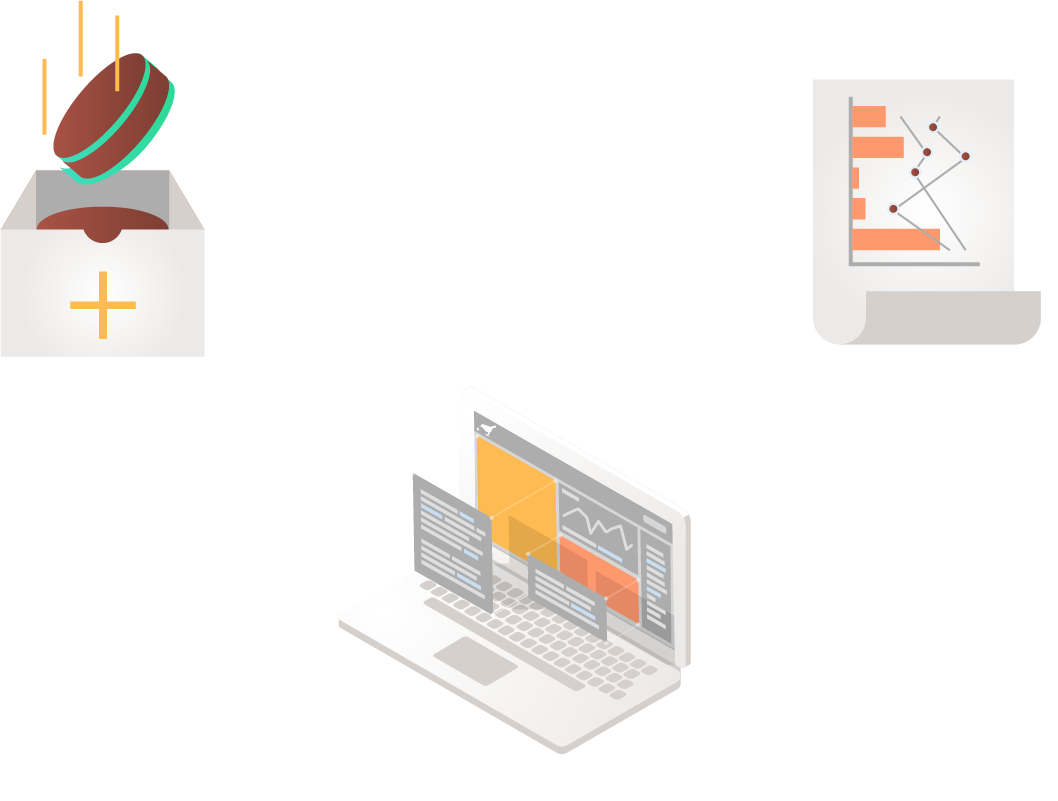
Machine Learning Supermarket Simulator (MLSS) includes three parts
We want to help you achieve success across every square meter of your store. Every product, located in the right bay, to meet the right target customer, and achieve maximum sales.

This is achieved by tracking trolleys armed with Breadcrumb’s precise location awareness sensors.

Trolleys armed with Breadcrumb’s precise location awareness sensors collect shopping path data with centimetre-level accuracy, and this data feeds our MLSS. The simulator can be used to predict traffic patterns based on different store layouts and product placements. This gives us the ability to virtually change the store layout and product placements and immediately see the results and store-wide impact.

Breadcrumb has developed a model which interprets the relationship between in-store traffic patterns and sales. Every product is assessed to see whether it has effectively leveraged the passing traffic. Some products may waste high traffic, and the sales of another products may be limited by low traffic. However, due to ripple effects and the huge number of variables, we can't simply switch the location of products. Optimising the sales of one product might reduce sales of another, so the focus must be on margins. This is why you need a simulator.
To quantitatively assess and optimise store layout and product placement is one use case for our MLSS. However, our MLSS is an analytics solution for a physical store, the way Google Analytics is for the online world.

Using our MLSS you can track the effect of promotional activity by viewing traffic and conversion rate results.

A franchisor can use quantity assessment to set benchmarks around store layout and product placement performance.
Use traffic patterns to identify hot areas for promotional displays.

Added over time
We'd love to talk about how we can work together.
{{success}}
{{error}}